For multifamily & portfolio owners
See which assets are quietly burning cash —
before the quarterly surprise.
Portfolio rollup, cross-property benchmarking, vacancy and freeze risk, baseline anomalies, turnover verification, and load-shape efficiency insights—so ownership can prioritize capital and ops with utility truth, not anecdotes.
- ✓ Built for owners who think in assets and NOI
- ✓ Benchmarking and load-shape insights across the book
- ✓ Early access open — limited portfolio spots
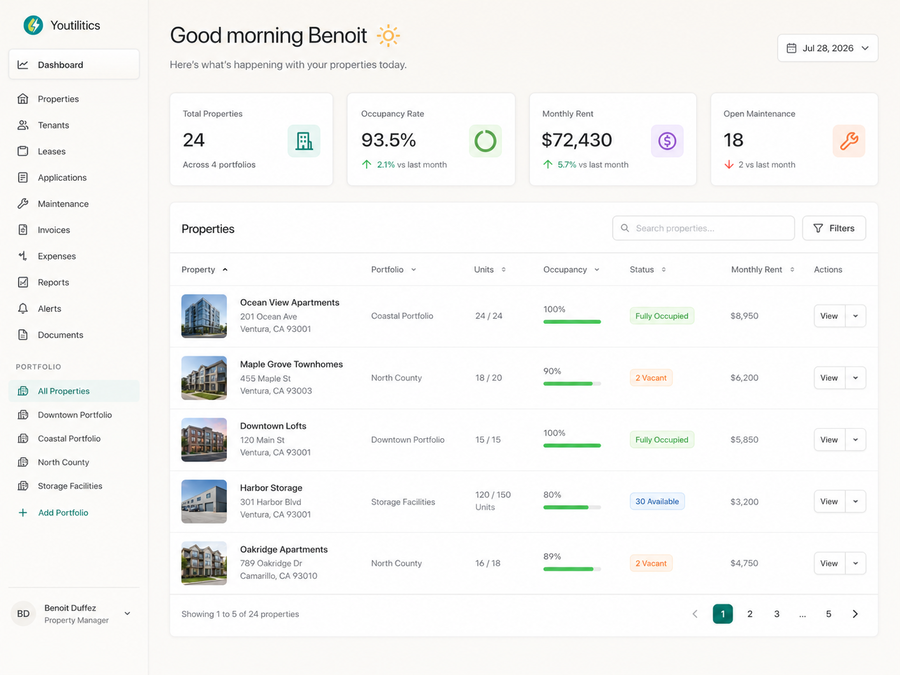
Product visuals are illustrative. Interfaces, features, and results may differ.
The challenge
Portfolio utilities stay opaque until variance hits the model
You get summarized property financials. Utilities bury variance in “ops.” Freeze events and chronic waste show up as capital events—not as last month’s clean dashboard.
Outliers hide in averages
One building’s water intensity can distort the story. Without benchmarking, you fund the wrong retrofit and miss the true problem child.
Risk is uneven across the book
Vacant wings, winter exposure, and included-utility structures create asymmetric freeze and overage risk that a single KPI never shows.
Investor questions need evidence
“Why did utilities spike?” needs timelines and peer context—not a forwarded PDF from a local manager three weeks late.
How Youtilitics helps
Ownership-layer utility intelligence
Roll up the portfolio, benchmark assets, watch freeze and vacancy risk, verify turnovers where it matters, and use load-shape insights to target efficiency—with exportable context for investor conversations.
Whether you self-manage or work through PMCs, ownership still needs a clear utility signal. Youtilitics focuses on rollups, risk, anomalies, and usage patterns that help you decide where money and attention go next.
Product visuals are illustrative. Interfaces, features, and results may differ.
How it works
Start with priority assets. Expand with confidence.
Connect compatible utilities for the buildings that matter most, baseline each asset, benchmark the set, and route alerts to asset managers who can act.
Connect priority assets
Start with a region, vintage, or value-add set where utilities are supported. Not every market or water provider will qualify—check coverage first.
Baseline and benchmark
Each asset gets its own baseline; the portfolio gets comparative views so outliers surface without drowning in noise.
Prioritize capital and ops
Use risk alerts and load-shape clues to sequence fixes, winterization, and efficiency work where ROI is real.
Utility compatibility required
Youtilitics only works where your utility can share interval usage data we support. Not every area is covered, and not every utility is compatible—water utilities in particular often cannot provide usable interval data. Electric (and sometimes gas) coverage is typically stronger where partners are live.
Before you plan a rollout, check coverage by location and supported utilities. We currently list 36 enabled utilities in the directory.
Features
What portfolio owners get with Youtilitics
Ownership-grade visibility: which assets need capital, which need ops attention, and where risk is clustering.
Portfolio dashboard
Asset-level status and exceptions in one ownership view—so utility risk is visible beside the rest of your mental model of the book.
Cross-property benchmarking
Compare intensity and exception rates across sister assets. Find the outliers that averages hide in consolidated financials.
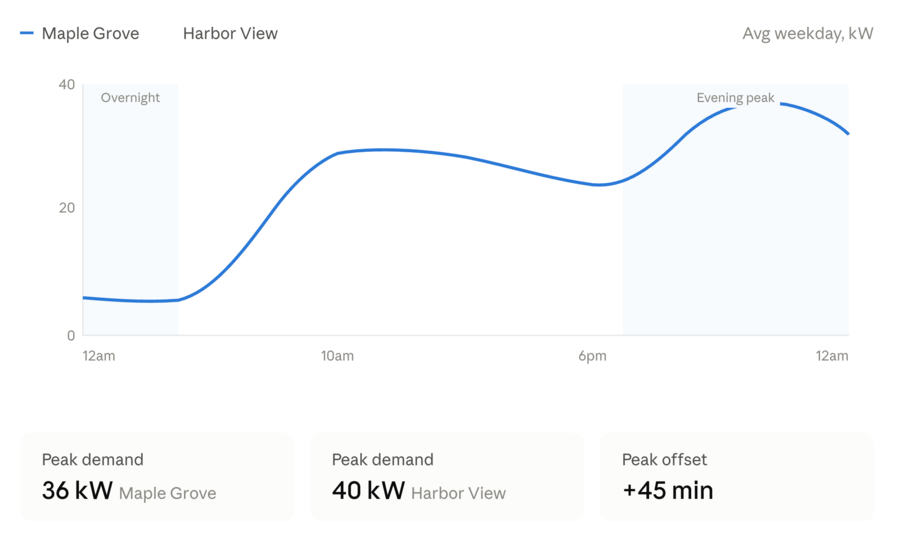
Load-shape efficiency insights
See when buildings use energy—not just how much. Target HVAC schedules, common-area loads, and operating habits with shape-level clues.
Vacancy and no-activity detection
Empty product that still consumes—or unexpected activity—becomes a managed signal across the portfolio.
Freeze and pipe-burst risk alerts
Protect high-exposure assets in cold markets. Ownership-level risk isn’t only an onsite problem; it’s a capital event you want fewer of.
Anomaly detection vs. each asset’s baseline
Drift and spikes against that building’s history—critical in mixed-vintage portfolios where “normal” differs by asset.
Move-in and move-out usage verification
Where metering supports it, document turnover windows for disputes and ops accountability.
Included-utilities overage alerts
When utilities are included in rent or structures create owner exposure, catch overages before they become permanent margin leaks.
Automated alerts (email, SMS, push)
Route signals to asset managers and partners. Ownership should hear about exceptions, not dig for them.
Exportable ownership context
Share timelines and summaries for investor updates and internal reviews—evidence you can attach to the utility narrative.
Built for ownership decisions at portfolio scale
Youtilitics helps ownership teams see risk and opportunity across assets—without pretending every building is a live IoT science project.
Asset and portfolio views together
Drill from book-level outliers into the properties that need capital, winterization, or ops follow-up.
Benchmarking that informs spend
Compare sister assets so retrofit and vendor dollars go where the data supports a return.
Works with how you already operate
Useful whether you self-manage or partner with PMCs—ownership still owns NOI and capital risk.
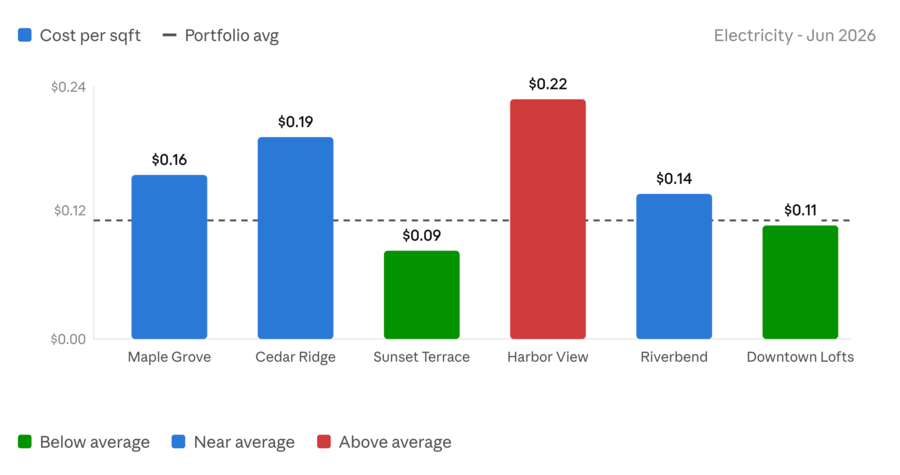
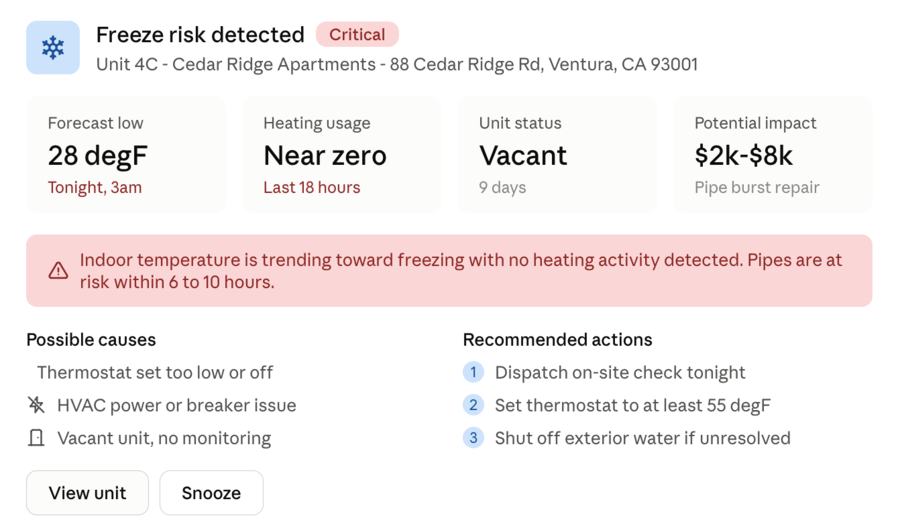
Screenshots and mockups on this page are conceptual examples only. Actual product screens, features, and results may differ.
FAQ
Common questions from portfolio owners
How does Youtilitics help multifamily and portfolio owners control utility costs?
It rolls up utility data across assets, benchmarks outliers, and alerts on vacancy waste, freeze risk, and baseline anomalies—so ownership can prioritize capital and ops where the data shows real leakage.
Can we benchmark utility performance across buildings?
Yes. Cross-property benchmarking highlights intensity and exception outliers so averages no longer hide the problem assets in the portfolio.
What are load-shape efficiency insights?
Load-shape insights show when buildings use energy—not only how much—so you can target schedules, common-area loads, and operating habits with clearer evidence.
Does this help with freeze risk across cold-market assets?
Yes. Freeze-risk alerts combine cold-weather context with low-heat or vacancy patterns so asset managers can intervene before pipe failures become capital events.
We already have a PMC. Why would ownership use Youtilitics?
Because NOI and capital risk still sit with ownership. Independent utility signal helps you ask better questions and prioritize the right buildings—with or without changing managers.
Does Youtilitics work with every utility across our portfolio?
No. Assets only connect where utilities share interval data we support. Coverage varies by market, and water is frequently unavailable. Validate coverage and supported utilities before modeling portfolio-wide assumptions.
How is this different from Youtilitics for a single home?
Home Youtilitics is for one primary residence. The multifamily and portfolio experience is built for multi-asset rollups, benchmarking, ownership alerts, and capital prioritization.
Why join early access?
Early access portfolio partners get onboarded first as spots open. Share unit count, markets, and whether benchmarking, freeze risk, or load-shape insights matter most—and we’ll schedule the right path.
Early access
Now accepting early access — limited multifamily and portfolio spots
Request access for your ownership team. Optional: units under ownership, markets, and your top priority.
We’ll only email you about early access and onboarding. Unsubscribe anytime.
Product descriptions, mockups, and sample outcomes on this page are for illustration. Availability depends on utility compatibility and location coverage. Features and results may differ from what is shown.