How can I save money on my Pasadena Water & Power bill?
Youtilitics is working on supporting Pasadena Water & Power. Please contact us if you would like to get it supported.
Pasadena Water & Power, since 1911, serves 65,000 in Pasadena, California. Fun fact: It powered the Rose Bowl's first electric scoreboard.
How do I interpret my Pasadena Water & Power bill?
A Pasadena Water & Power statement usually mixes fixed fees with usage-based charges. Reading line items alongside interval data is the fastest way to explain a surprise total.
- Customer/service charge — fixed fee independent of usage
- Usage (volumetric) charge — multiplies kWh, therms, or gallons by the rate or tier
- Delivery vs generation (electric) — sometimes shown as separate line items
- Taxes, franchise fees, and riders — vary by city and utility
- Time-of-use or tiered pricing — the same kWh can cost more at peak hours or higher tiers
- Sewer charges often track water volume — irrigation spikes raise both water and sewer lines
- Compare your Pasadena Water & Power usage history month to month; dollar totals alone hide weather and rate changes
What is a typical monthly usage for Pasadena Water & Power customers?
There is no single “correct” monthly use—climate, home size, and appliances matter more than the utility brand. Use these U.S. residential electricity benchmarks as a starting point, then compare against your own Pasadena Water & Power history:
- Typical U.S. household electricity use: about 855 kWh/month
- National-average residential rate context: about 16.2¢/kWh (approx. 2024–2025 EIA ranges)
- Illustrative energy cost at those averages: roughly $140/month before fixed fees
- Your best benchmark is last year’s same month from Pasadena Water & Power, not a national average
Sources: EIA Electric Power Monthly and RECS.
How can I lower my Pasadena Water & Power bill?
- Track daily or hourly usage so a single high bill does not stay a mystery
- Cut continuous loads first (leaks, stuck valves, always-on equipment)
- Audit irrigation schedules seasonally—overwatering is a top driver of sudden water bills
- Identify baseline kW at night; vampire load often costs ~$100+/year per household
- Shift flexible loads (EV, dishwasher, laundry) to off-peak windows when available
- Tune HVAC: 1–2°F setback, filter changes, and sealing duct leaks
- Upgrade high-use lighting and appliances to ENERGY STAR where payback is clear
- Re-check charts after each change to confirm the drop before the next bill
What features help with Pasadena Water & Power data?
- Automatic or regular sync of electricity, water history from Pasadena Water & Power
- Clear charts that show how much you use and when
- Alerts when usage jumps—useful for leaks, irrigation faults, or HVAC issues
- One place to track electricity, water trends without digging through PDFs
See the full features list for dashboard and analysis details.
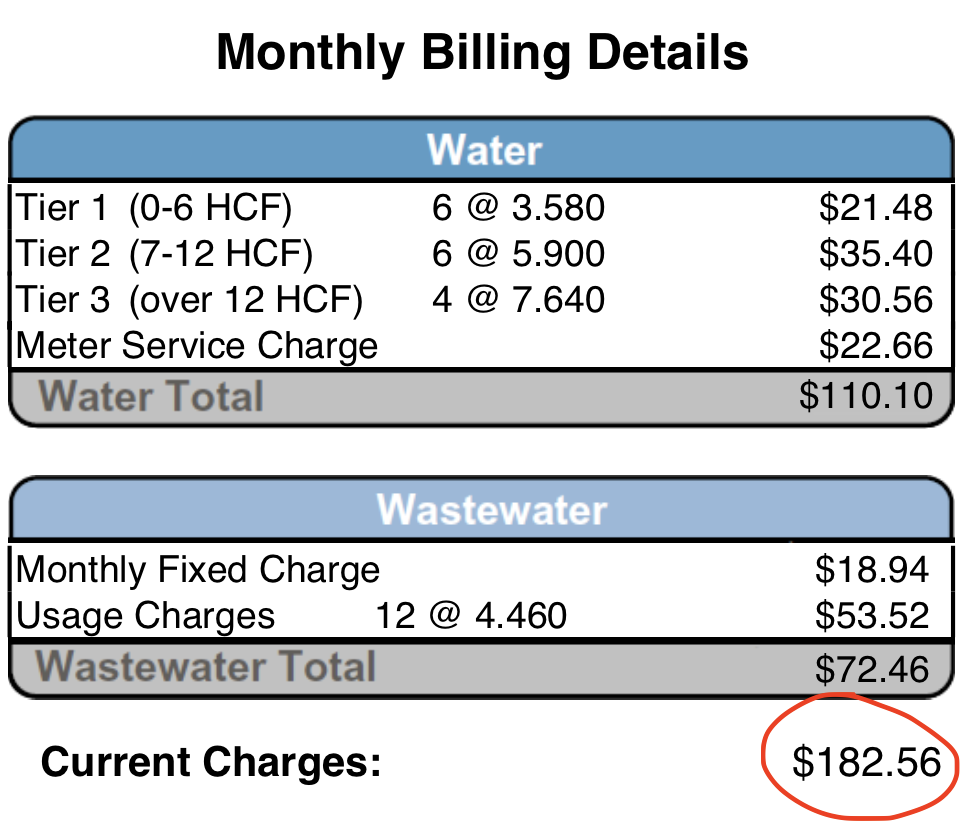
Turn this
Into this
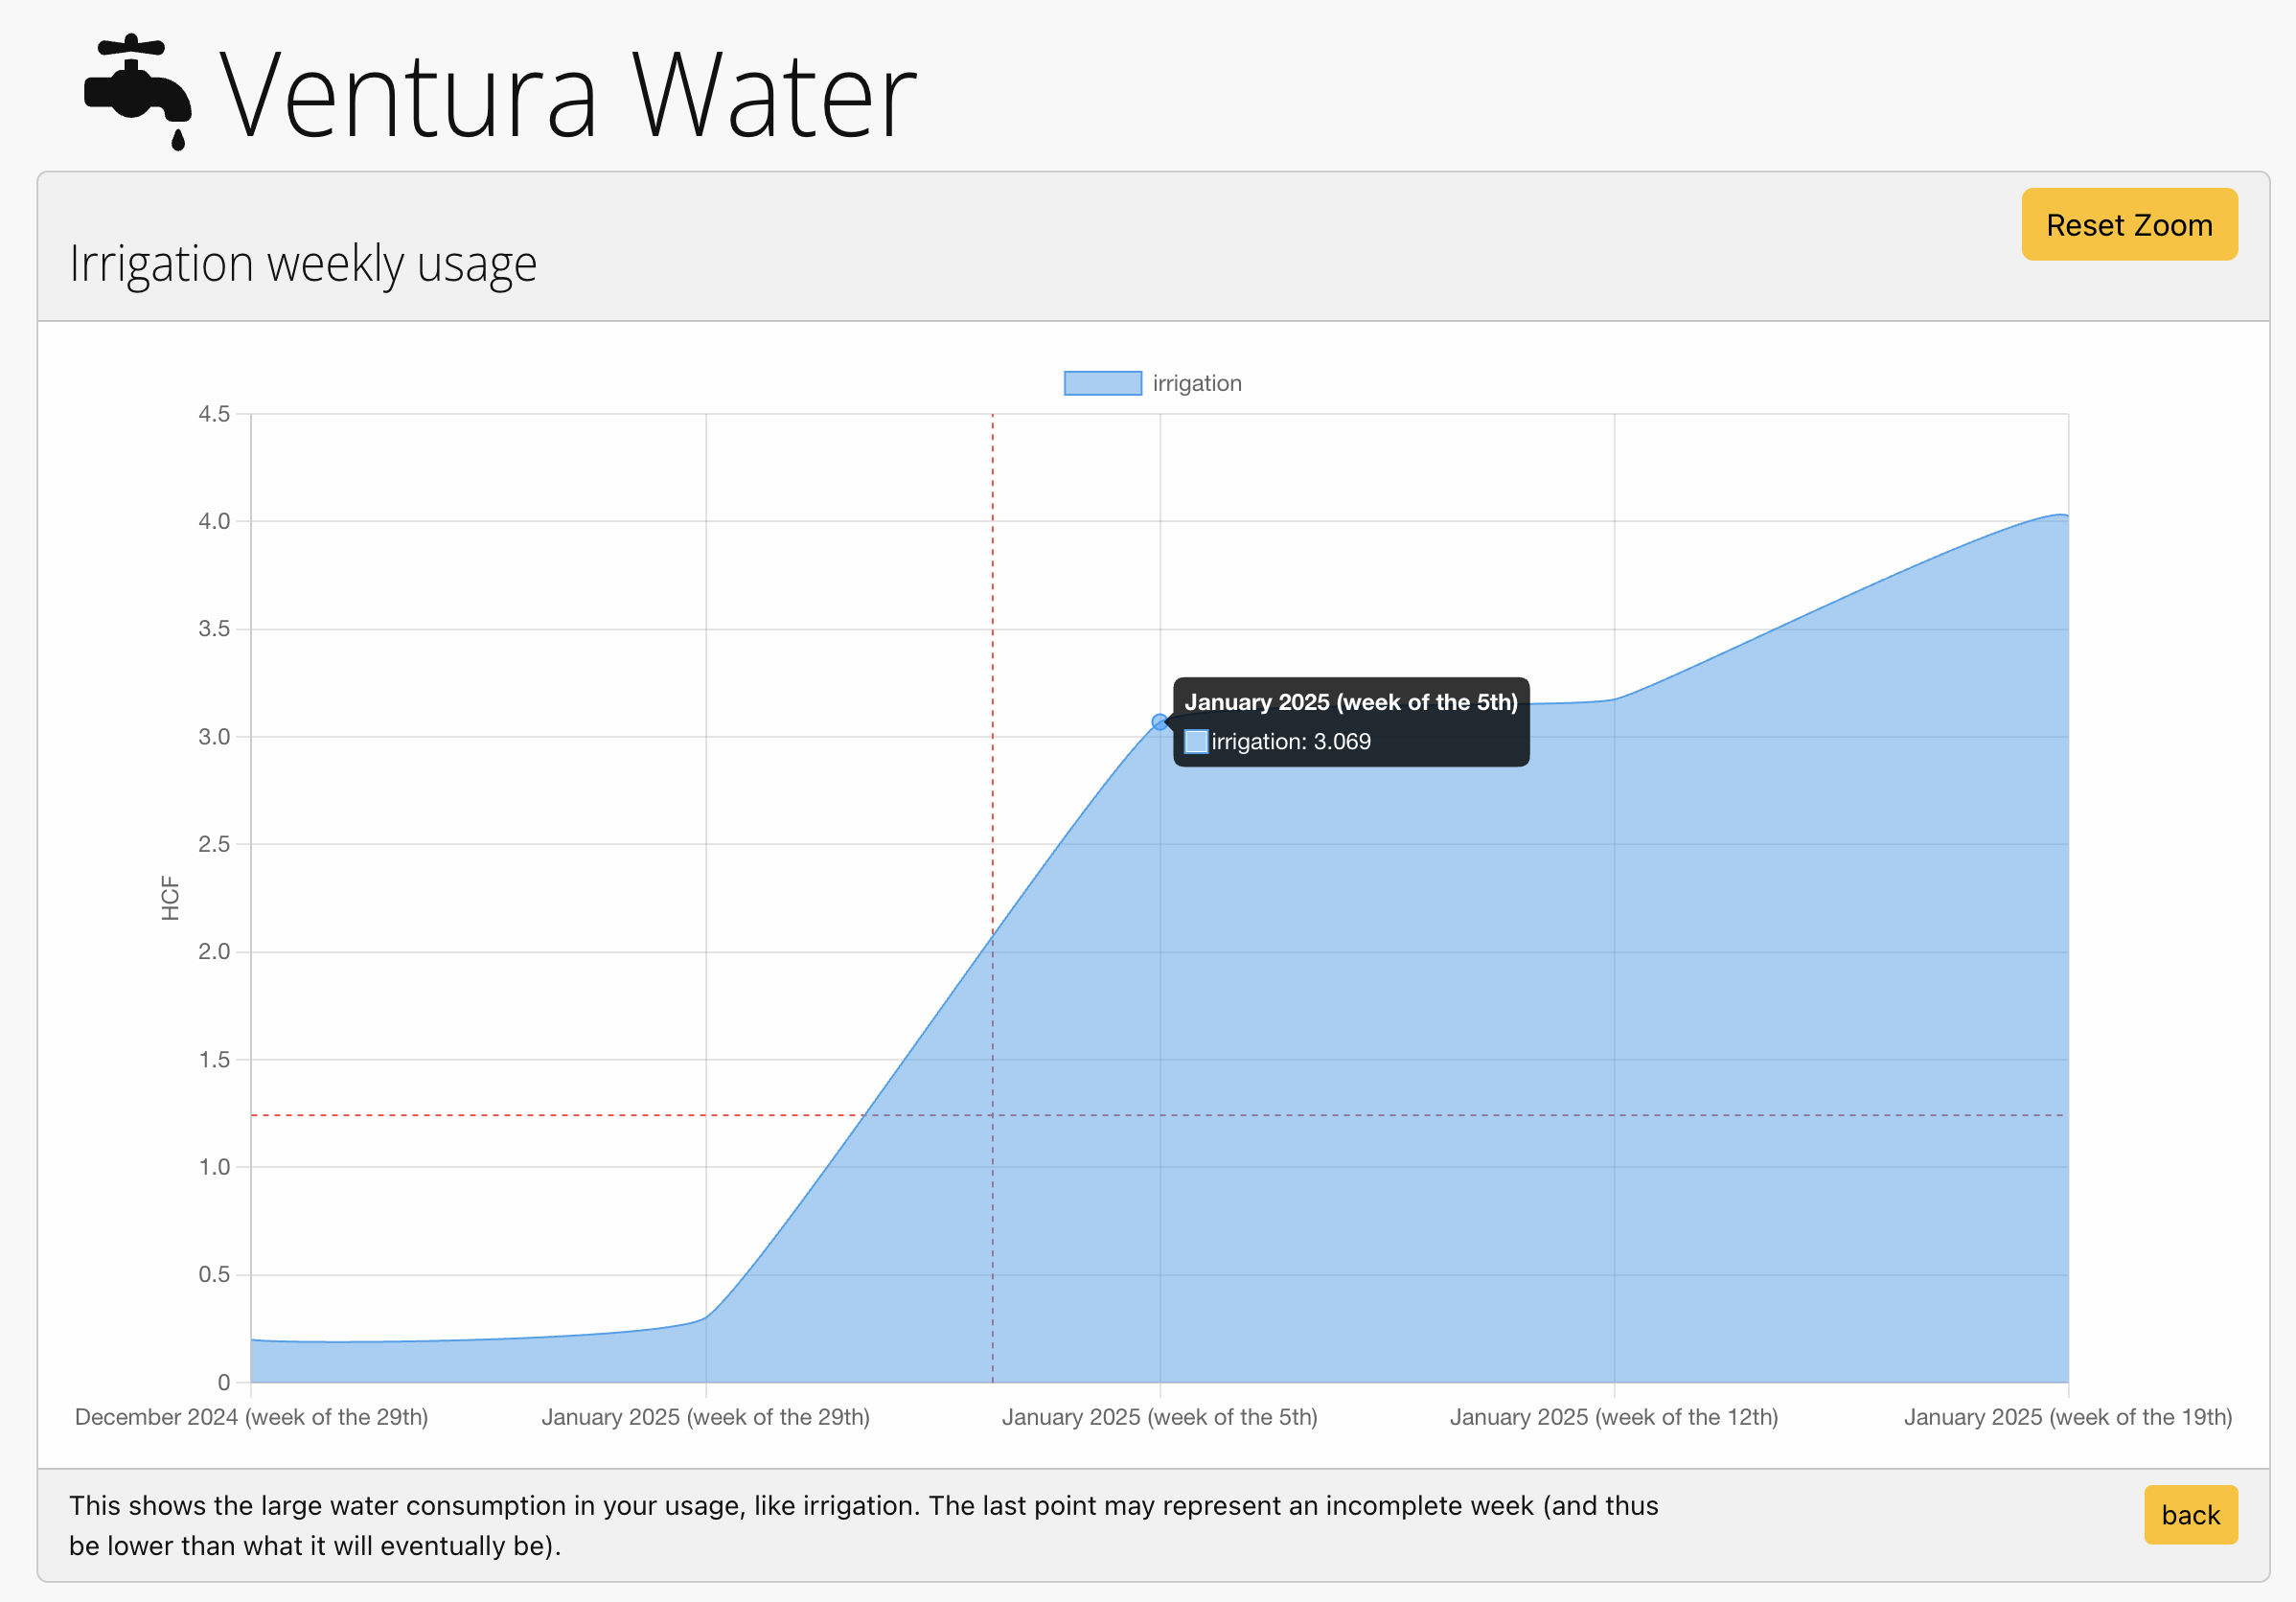
Youtilitics turns a confusingly high bill from your utility into a clear graph.
This 80% surge of price in this water bill was caused by irrigation.
How does it work with Pasadena Water & Power?
Youtilitics analyzes your electricity, water consumption with Pasadena Water & Power. Follow these steps:
- Connect your utility account. Link Pasadena Water & Power (or upload Green Button / usage files) so Youtilitics can import meter history.
- Review charts for spikes and baseline load. Look for overnight baseline, irrigation peaks, EV charging windows, and HVAC ramps that drive the bill.
- Fix or schedule the biggest loads. Repair leaks, reprogram irrigation, move EV charging off-peak, and adjust thermostat schedules.
- Confirm savings with alerts and follow-up charts. Use spike alerts and month-over-month charts to verify usage dropped after each change.
This utility may not offer a public usage download path. Check your Pasadena Water & Power dashboard for CSV or Green Button options. If you find one, please contact us to get it supported.
Please reach out if you are a Pasadena Water & Power customer and
would
like your data in Youtilitics.
We will give you free access for a year if you help us support Pasadena Water & Power.
Do I need to check Youtilitics every day?
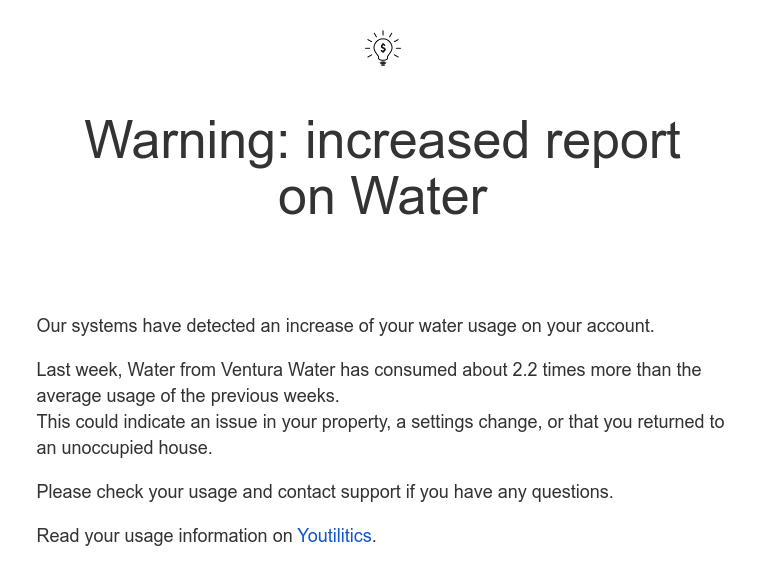
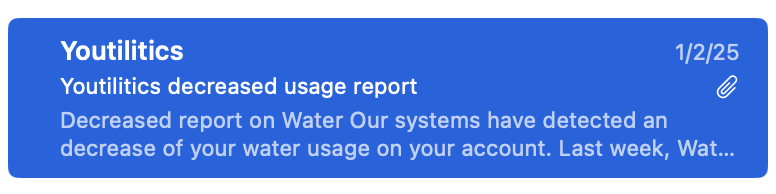
No. Systems check your usage routinely and can alert you if there is a sudden spike—so you hear about problems before the paper bill arrives.
Email alert
Problem solved
Frequently asked questions
How do I interpret my Pasadena Water & Power bill?
Most Pasadena Water & Power bills combine fixed charges (service/customer fees) with usage charges based on electricity, water consumed. Compare total usage to prior months, note any tier or time-of-use periods, and look for unusual spikes. Youtilitics charts the same meter data so you can see when usage rose instead of only seeing a dollar total.
What is a typical monthly usage for Pasadena Water & Power customers?
Usage varies by home size, climate, and appliances. As a U.S. residential electricity benchmark, many households use roughly 855 kWh per month (about $139 at a national-average rate near 16.2¢/kWh). Your Pasadena Water & Power history is the best baseline—compare your own months rather than a single national figure.
Can Youtilitics connect to Pasadena Water & Power?
It depends on Pasadena Water & Power. Check your online account for usage downloads (CSV or Green Button). If you find a download option, contact us so we can add support.
How can I lower my Pasadena Water & Power bill?
Start with visibility: track electricity, water daily or hourly to find peaks. Common wins include fixing leaks or continuous irrigation, shifting EV charging off-peak, reducing baseline “always-on” load, and tuning HVAC setpoints. Then re-check the same charts after each change to confirm savings.
Sources and evidence
Figures below are approximate statewide or national averages for context. Your bill and tariff always control.
- U.S. Energy Information Administration (EIA) — Residential electricity prices and sales (Electric Power Monthly)
- U.S. Energy Information Administration — RECS — Residential Energy Consumption Survey (typical household usage)
- NREL National Solar Radiation Database — Solar resource context for rooftop potential notes
- U.S. Department of Energy — Home energy-saving practices and idle-load guidance
Start saving on your Pasadena Water & Power bill.
Get alerts when your energy usage looks abnormal — free trial, no card required.