How can I save money on my SCE bill?

Youtilitics can download data from SCE and analyze it to help you save money.
Southern California Edison (SCE), a subsidiary of Edison International, is the primary electric utility for much of Southern California, serving 15 million people across a 50,000-square-mile region. Headquartered in Rosemead, SCE manages an extensive network of transmission and distribution lines, delivering reliable electricity to 5 million customer accounts. With a focus on clean energy, SCE powers its grid with a mix of hydroelectric, solar, and wind resources, retaining 1,200 MW of hydroelectric capacity and advancing projects like the Tehachapi Pass Wind Farm to meet California's renewable energy mandates.
Since its origins in 1908 with the Big Creek Hydroelectric Project, SCE has grown into a leader in energy innovation, offering rebates for energy-efficient appliances and operating unique gas and water utilities on Santa Catalina Island. The company is committed to achieving net-zero greenhouse gas emissions by 2045, investing in grid resilience, and supporting customers impacted by wildfires like the Thomas Fire. With a legacy of over a century, SCE continues to electrify Southern California while driving sustainability and customer-focused solutions.
What should SCE customers know about rates and data?
| Peak window | 4 PM – 9 PM (weekdays; TOU-D-4-9PM default) |
|---|---|
| Rate structure | Time-of-Use (TOU) & Tiered |
| Peak rate | Summer weekday on-peak about 58¢/kWh on TOU-D-4-9PM (before baseline credit) |
| Off-peak rate | Summer weekday off-peak about 34¢/kWh before baseline credit, about 24¢/kWh after |
| Primary states | California |
| Timezone | America/Los_Angeles |
| Sync type | Green Button Connect My Data (OAuth 2.0) |
| Supported protocols | Green Button Connect My Data (OAuth 2.0 authorization_code) |
| Common smart meters | Itron OpenWay, Landis+Gyr |
| Interval data | Hourly or 15-minute interval reads via Green Button Connect My Data |
| Customers | About 15 million people across a 50,000-square-mile service territory |
Rates and windows are published tariff context, not a personalized quote. Your bill and tariff always control.
How do peak-rate anomalies happen for SCE customers?
Southern California Edison bills most residential customers on time-of-use, not a single cents-per-kWh number. The default TOU-D-4-9PM plan puts the highest prices on weekdays from 4 PM to 9 PM. In summer (June through September) that on-peak block is about 58¢/kWh before the baseline credit. Off-peak on the same weekday is about 34¢ before the credit and about 24¢ after it. Weekend afternoons are mid-peak, not the full on-peak price. A shorter TOU-D-5-8PM option compresses the expensive window to three hours but can post an even higher on-peak cents figure. A remaining tiered plan still exists, so two neighbors can see very different “same kWh” costs.
A peak-rate anomaly at SCE is usually a coincidence of clock and load, not a meter error. Air conditioning that ramps as people get home, an EV that plugs in at 5 PM, a pool pump on a factory timer, or cooking plus laundry in the dinner window all land in the 4–9 PM weekday block. Because on-peak summer energy can cost roughly 1.7× off-peak before the baseline credit (58¢ vs 34¢), shifting 200 kWh out of that window is a material bill change even if total kWh is unchanged. The baseline credit widens the gap further for usage below the allocation (48¢ vs 24¢ after credit on the published TOU-D-4-9PM summer weekday figures). Inland valleys feel this more than mild coastal zones because cooling load sits exactly on the peak clock.
SCE’s Edison SmartConnect meters—Itron OpenWay and Landis+Gyr—record hourly or 15-minute intervals. Youtilitics imports that history through Green Button Connect My Data with OAuth 2.0; SCE issued a client ID after the certification partnership, so customers authorize once instead of uploading XML each month. Charts are in America/Los_Angeles. Overlay 4–9 PM weekdays in summer to see the expensive hours. A flat overnight baseline is always-on load. A weekend 6 PM that is cheaper than a Wednesday 6 PM is the mid-peak vs on-peak rule.
Interval monitoring is how SCE customers prove a change worked. Move EV charging after 9 PM and the next week’s 4–9 PM kWh should drop while overnight kWh rises. If every hour jumped, look at HVAC or a failed device, not just “the rate went up.” Alerts catch a new evening spike before the next statement. For about 15 million people across 50,000 square miles of Southern California, that Green Button feed is the difference between a 58¢ hour you can see and a bill total you cannot explain.
How do I interpret my SCE bill?
A SCE statement usually mixes fixed fees with usage-based charges. Reading line items alongside interval data is the fastest way to explain a surprise total.
- Customer/service charge — fixed fee independent of usage
- Usage (volumetric) charge — multiplies kWh, therms, or gallons by the rate or tier
- Delivery vs generation (electric) — sometimes shown as separate line items
- Taxes, franchise fees, and riders — vary by city and utility
- Time-of-use or tiered pricing — the same kWh can cost more at peak hours or higher tiers
- Compare your SCE usage history month to month; dollar totals alone hide weather and rate changes
What is a typical monthly usage for SCE customers?
There is no single “correct” monthly use—climate, home size, and appliances matter more than the utility brand. Use these U.S. residential electricity benchmarks as a starting point, then compare against your own SCE history:
- Typical U.S. household electricity use: about 855 kWh/month
- National-average residential rate context: about 16.2¢/kWh (approx. 2024–2025 EIA ranges)
- Illustrative energy cost at those averages: roughly $140/month before fixed fees
- Your best benchmark is last year’s same month from SCE, not a national average
Sources: EIA Electric Power Monthly and RECS.
How can I lower my SCE bill?
- Track daily or hourly usage so a single high bill does not stay a mystery
- Cut continuous loads first (leaks, stuck valves, always-on equipment)
- Shift flexible loads (EV, dishwasher, laundry) to off-peak windows when available
- Identify baseline kW at night; vampire load often costs ~$100+/year per household
- Tune HVAC: 1–2°F setback, filter changes, and sealing duct leaks
- Upgrade high-use lighting and appliances to ENERGY STAR where payback is clear
- Re-check charts after each change to confirm the drop before the next bill
What features help with SCE data?
- Automatic or regular sync of electricity history from SCE
- Clear charts that show how much you use and when
- Alerts when usage jumps—useful for leaks, irrigation faults, or HVAC issues
- One place to track electricity trends without digging through PDFs
See the full features list for dashboard and analysis details.
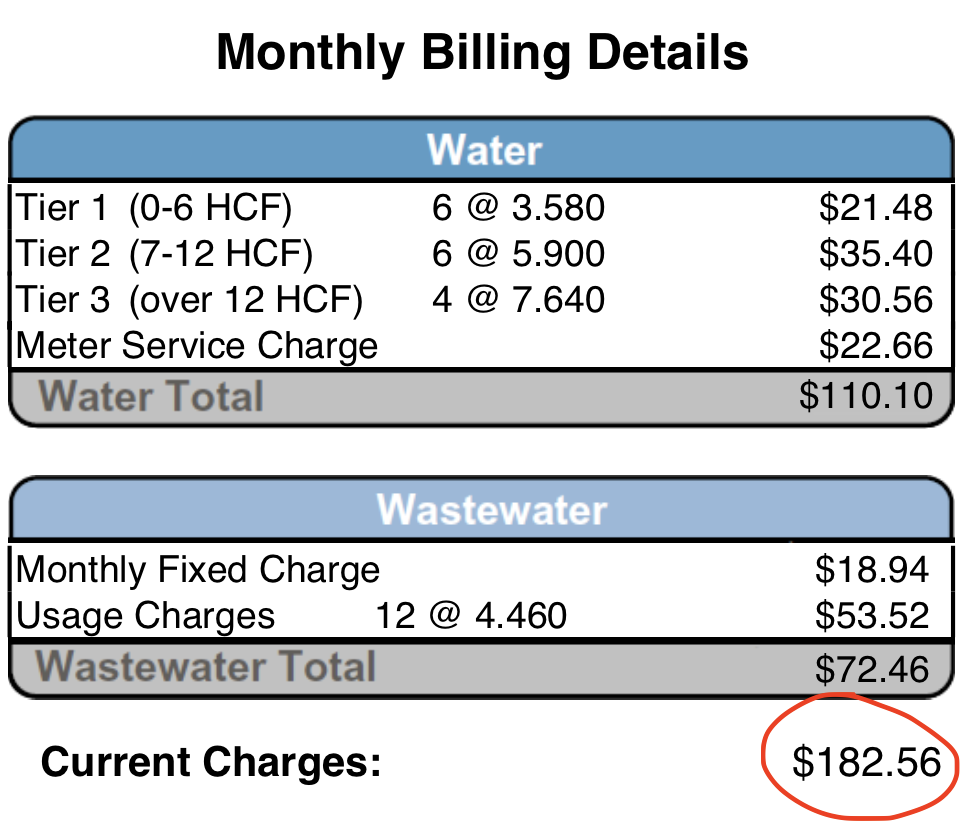
Turn this
Into this
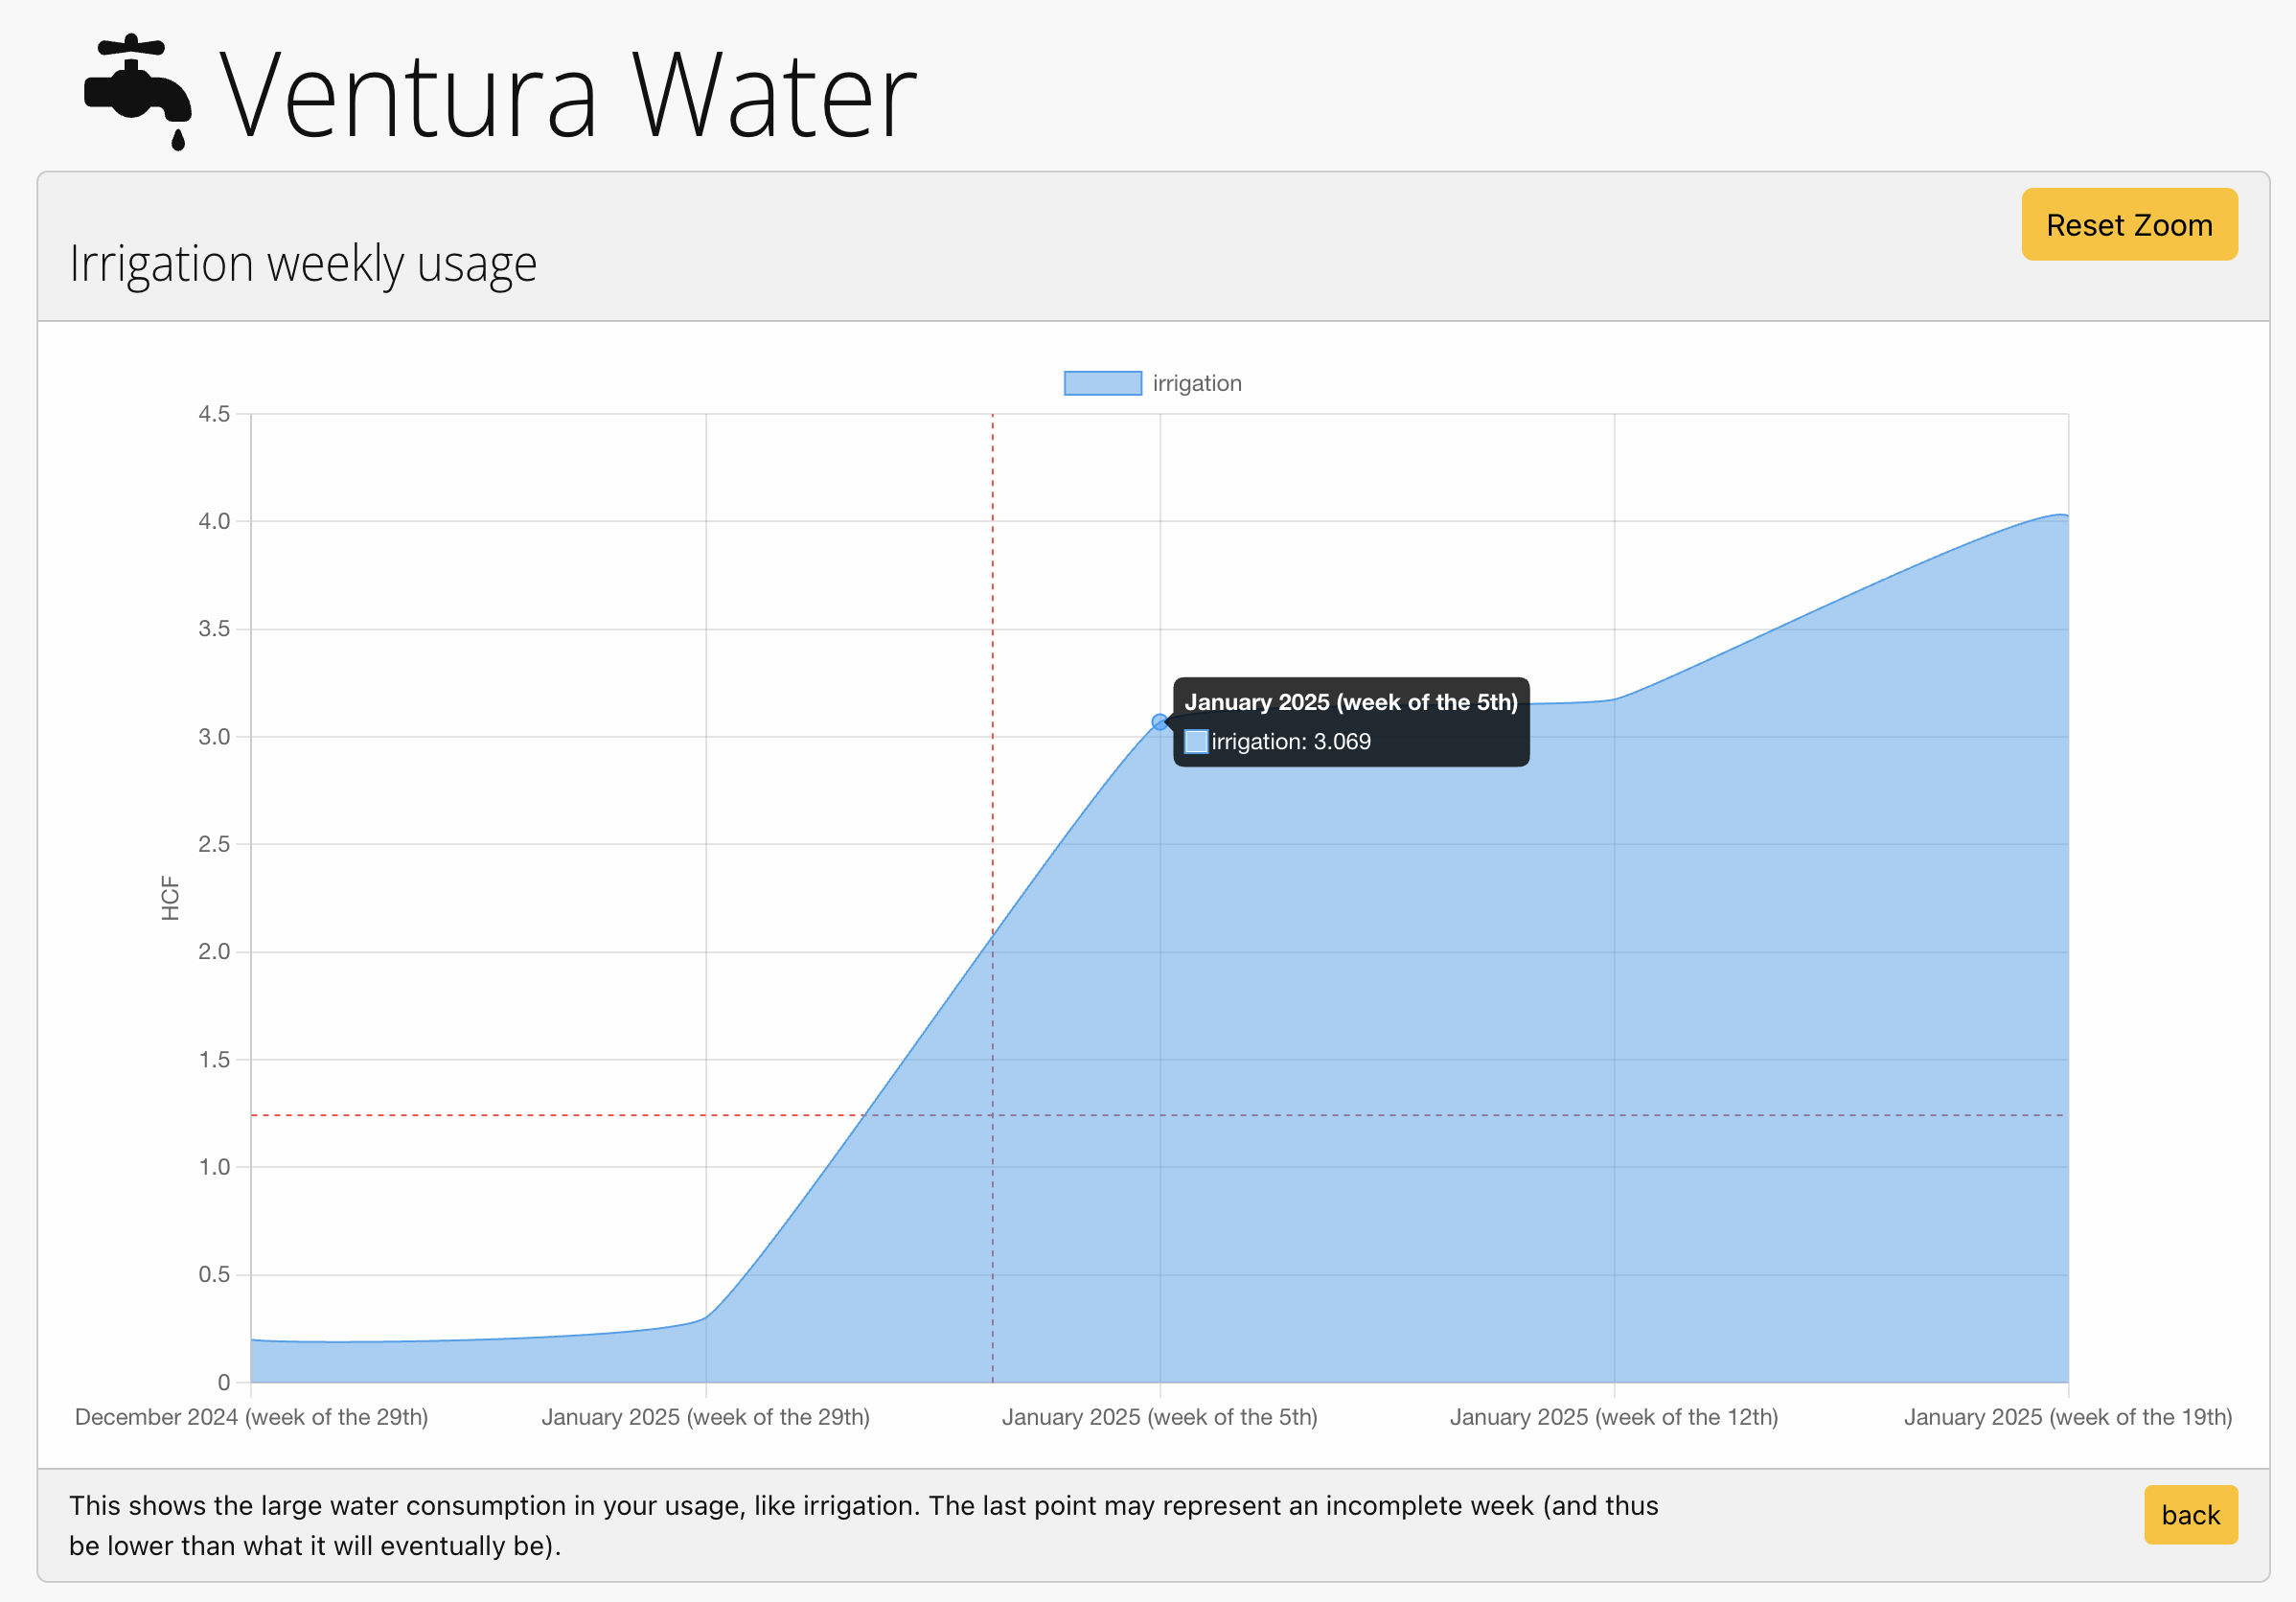
Youtilitics turns a confusingly high bill from your utility into a clear graph.
This 80% surge of price in this water bill was caused by irrigation.
How does it work with SCE?
Youtilitics analyzes your electricity consumption with SCE. Follow these steps:
- Connect your utility account. Link SCE (or upload Green Button / usage files) so Youtilitics can import meter history.
- Review charts for spikes and baseline load. Look for overnight baseline, irrigation peaks, EV charging windows, and HVAC ramps that drive the bill.
- Fix or schedule the biggest loads. Repair leaks, reprogram irrigation, move EV charging off-peak, and adjust thermostat schedules.
- Confirm savings with alerts and follow-up charts. Use spike alerts and month-over-month charts to verify usage dropped after each change.
This utility is compatible with Green Button™ and can automatically download your usage data via Connect My Data.
Do I need to check Youtilitics every day?
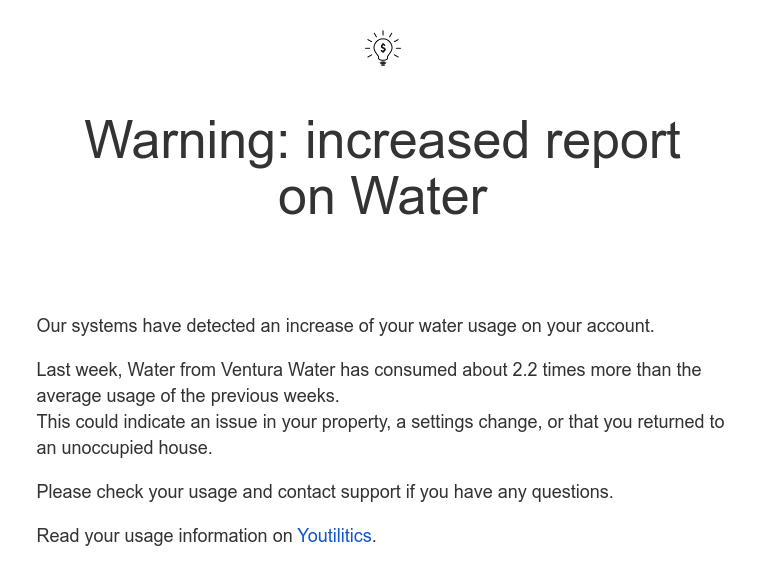
No. Systems check your usage routinely and can alert you if there is a sudden spike—so you hear about problems before the paper bill arrives.
Email alert
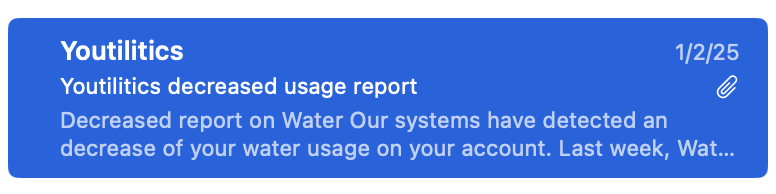
Problem solved
Frequently asked questions
How do I interpret my SCE bill?
Most SCE bills combine fixed charges (service/customer fees) with usage charges based on electricity consumed. Compare total usage to prior months, note any tier or time-of-use periods, and look for unusual spikes. Youtilitics charts the same meter data so you can see when usage rose instead of only seeing a dollar total.
When are SCE peak hours?
SCE peak hours are 4 PM – 9 PM (weekdays; TOU-D-4-9PM default). Published context: Summer weekday on-peak about 58¢/kWh on TOU-D-4-9PM (before baseline credit) versus Summer weekday off-peak about 34¢/kWh before baseline credit, about 24¢/kWh after. Interval charts show whether EV charging, HVAC, or appliances actually landed in that window.
What is a typical monthly usage for SCE customers?
Usage varies by home size, climate, and appliances. As a U.S. residential electricity benchmark, many households use roughly 855 kWh per month (about $139 at a national-average rate near 16.2¢/kWh). Your SCE history is the best baseline—compare your own months rather than a single national figure.
Can Youtilitics connect to SCE?
Yes. SCE is certified for Green Button Connect My Data (OAuth 2.0). Link your account once and Youtilitics imports interval history automatically.
How can I lower my SCE bill?
Start with visibility: track electricity daily or hourly to find peaks. Common wins include fixing leaks or continuous irrigation, shifting EV charging off-peak, reducing baseline “always-on” load, and tuning HVAC setpoints. Then re-check the same charts after each change to confirm savings.
Sources and evidence
Figures below are approximate statewide or national averages for context. Your bill and tariff always control.
- U.S. Energy Information Administration (EIA) — Residential electricity prices and sales (Electric Power Monthly)
- U.S. Energy Information Administration — RECS — Residential Energy Consumption Survey (typical household usage)
- NREL National Solar Radiation Database — Solar resource context for rooftop potential notes
- U.S. Department of Energy — Home energy-saving practices and idle-load guidance
- SCE — Time-of-Use residential rate plans — peak_window TOU-D 4–9 p.m. and published summer on-peak / off-peak cents
- SCE — Residential rate plans — rate_structure_type (TOU and tiered options)
- SCE — Tiered rate plan — summer June–September vs winter October–May seasons
Start saving on your SCE bill.
Get alerts when your energy usage looks abnormal — free trial, no card required.