How can I save money on my Village of Johnson bill?
Youtilitics is working on supporting Village of Johnson. Please contact us if you would like to get it supported.
Village of Johnson, since 1894, powers 1,700 in Johnson, Vermont. Fun fact: It owns a small hydro plant on the Gihon River, a local gem.
How do I interpret my Village of Johnson bill?
A Village of Johnson statement usually mixes fixed fees with usage-based charges. Reading line items alongside interval data is the fastest way to explain a surprise total.
- Customer/service charge — fixed fee independent of usage
- Usage (volumetric) charge — multiplies kWh, therms, or gallons by the rate or tier
- Delivery vs generation (electric) — sometimes shown as separate line items
- Taxes, franchise fees, and riders — vary by city and utility
- Time-of-use or tiered pricing — the same kWh can cost more at peak hours or higher tiers
- Compare your Village of Johnson usage history month to month; dollar totals alone hide weather and rate changes
What is a typical monthly usage for Village of Johnson customers?
There is no single “correct” monthly use—climate, home size, and appliances matter more than the utility brand. Use these U.S. residential electricity benchmarks as a starting point, then compare against your own Village of Johnson history:
- Typical U.S. household electricity use: about 855 kWh/month
- National-average residential rate context: about 16.2¢/kWh (approx. 2024–2025 EIA ranges)
- Illustrative energy cost at those averages: roughly $140/month before fixed fees
- Your best benchmark is last year’s same month from Village of Johnson, not a national average
Sources: EIA Electric Power Monthly and RECS.
How can I lower my Village of Johnson bill?
- Track daily or hourly usage so a single high bill does not stay a mystery
- Cut continuous loads first (leaks, stuck valves, always-on equipment)
- Shift flexible loads (EV, dishwasher, laundry) to off-peak windows when available
- Identify baseline kW at night; vampire load often costs ~$100+/year per household
- Tune HVAC: 1–2°F setback, filter changes, and sealing duct leaks
- Upgrade high-use lighting and appliances to ENERGY STAR where payback is clear
- Re-check charts after each change to confirm the drop before the next bill
What features help with Village of Johnson data?
- Automatic or regular sync of electricity history from Village of Johnson
- Clear charts that show how much you use and when
- Alerts when usage jumps—useful for leaks, irrigation faults, or HVAC issues
- One place to track electricity trends without digging through PDFs
See the full features list for dashboard and analysis details.
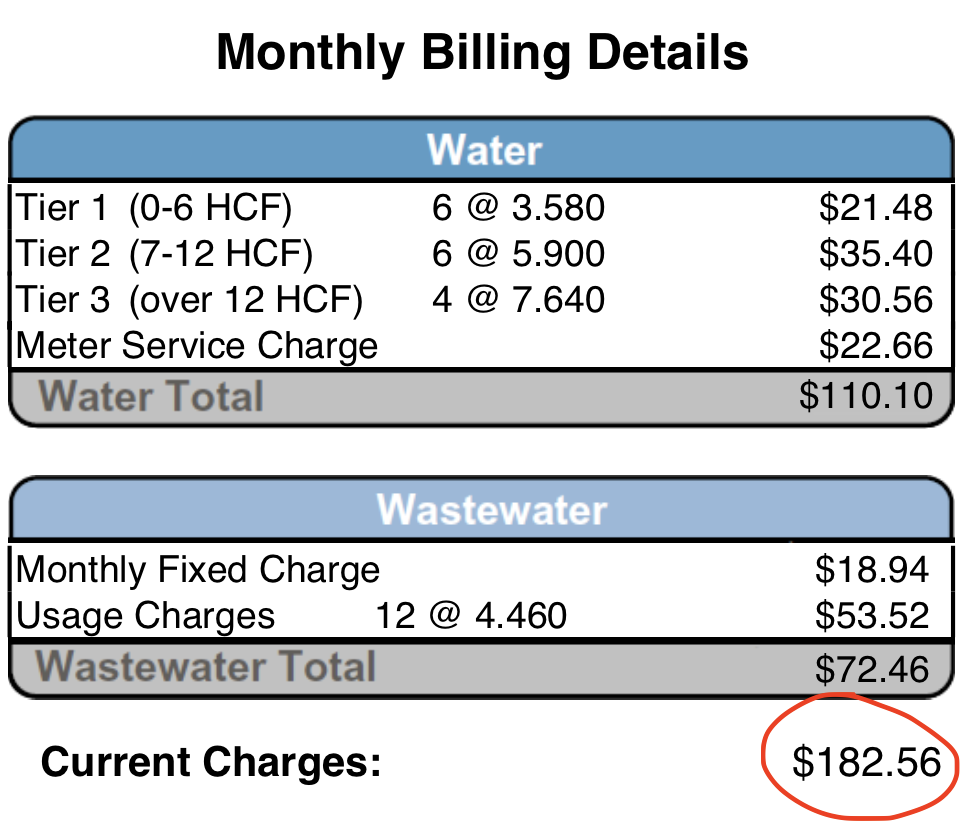
Turn this
Into this
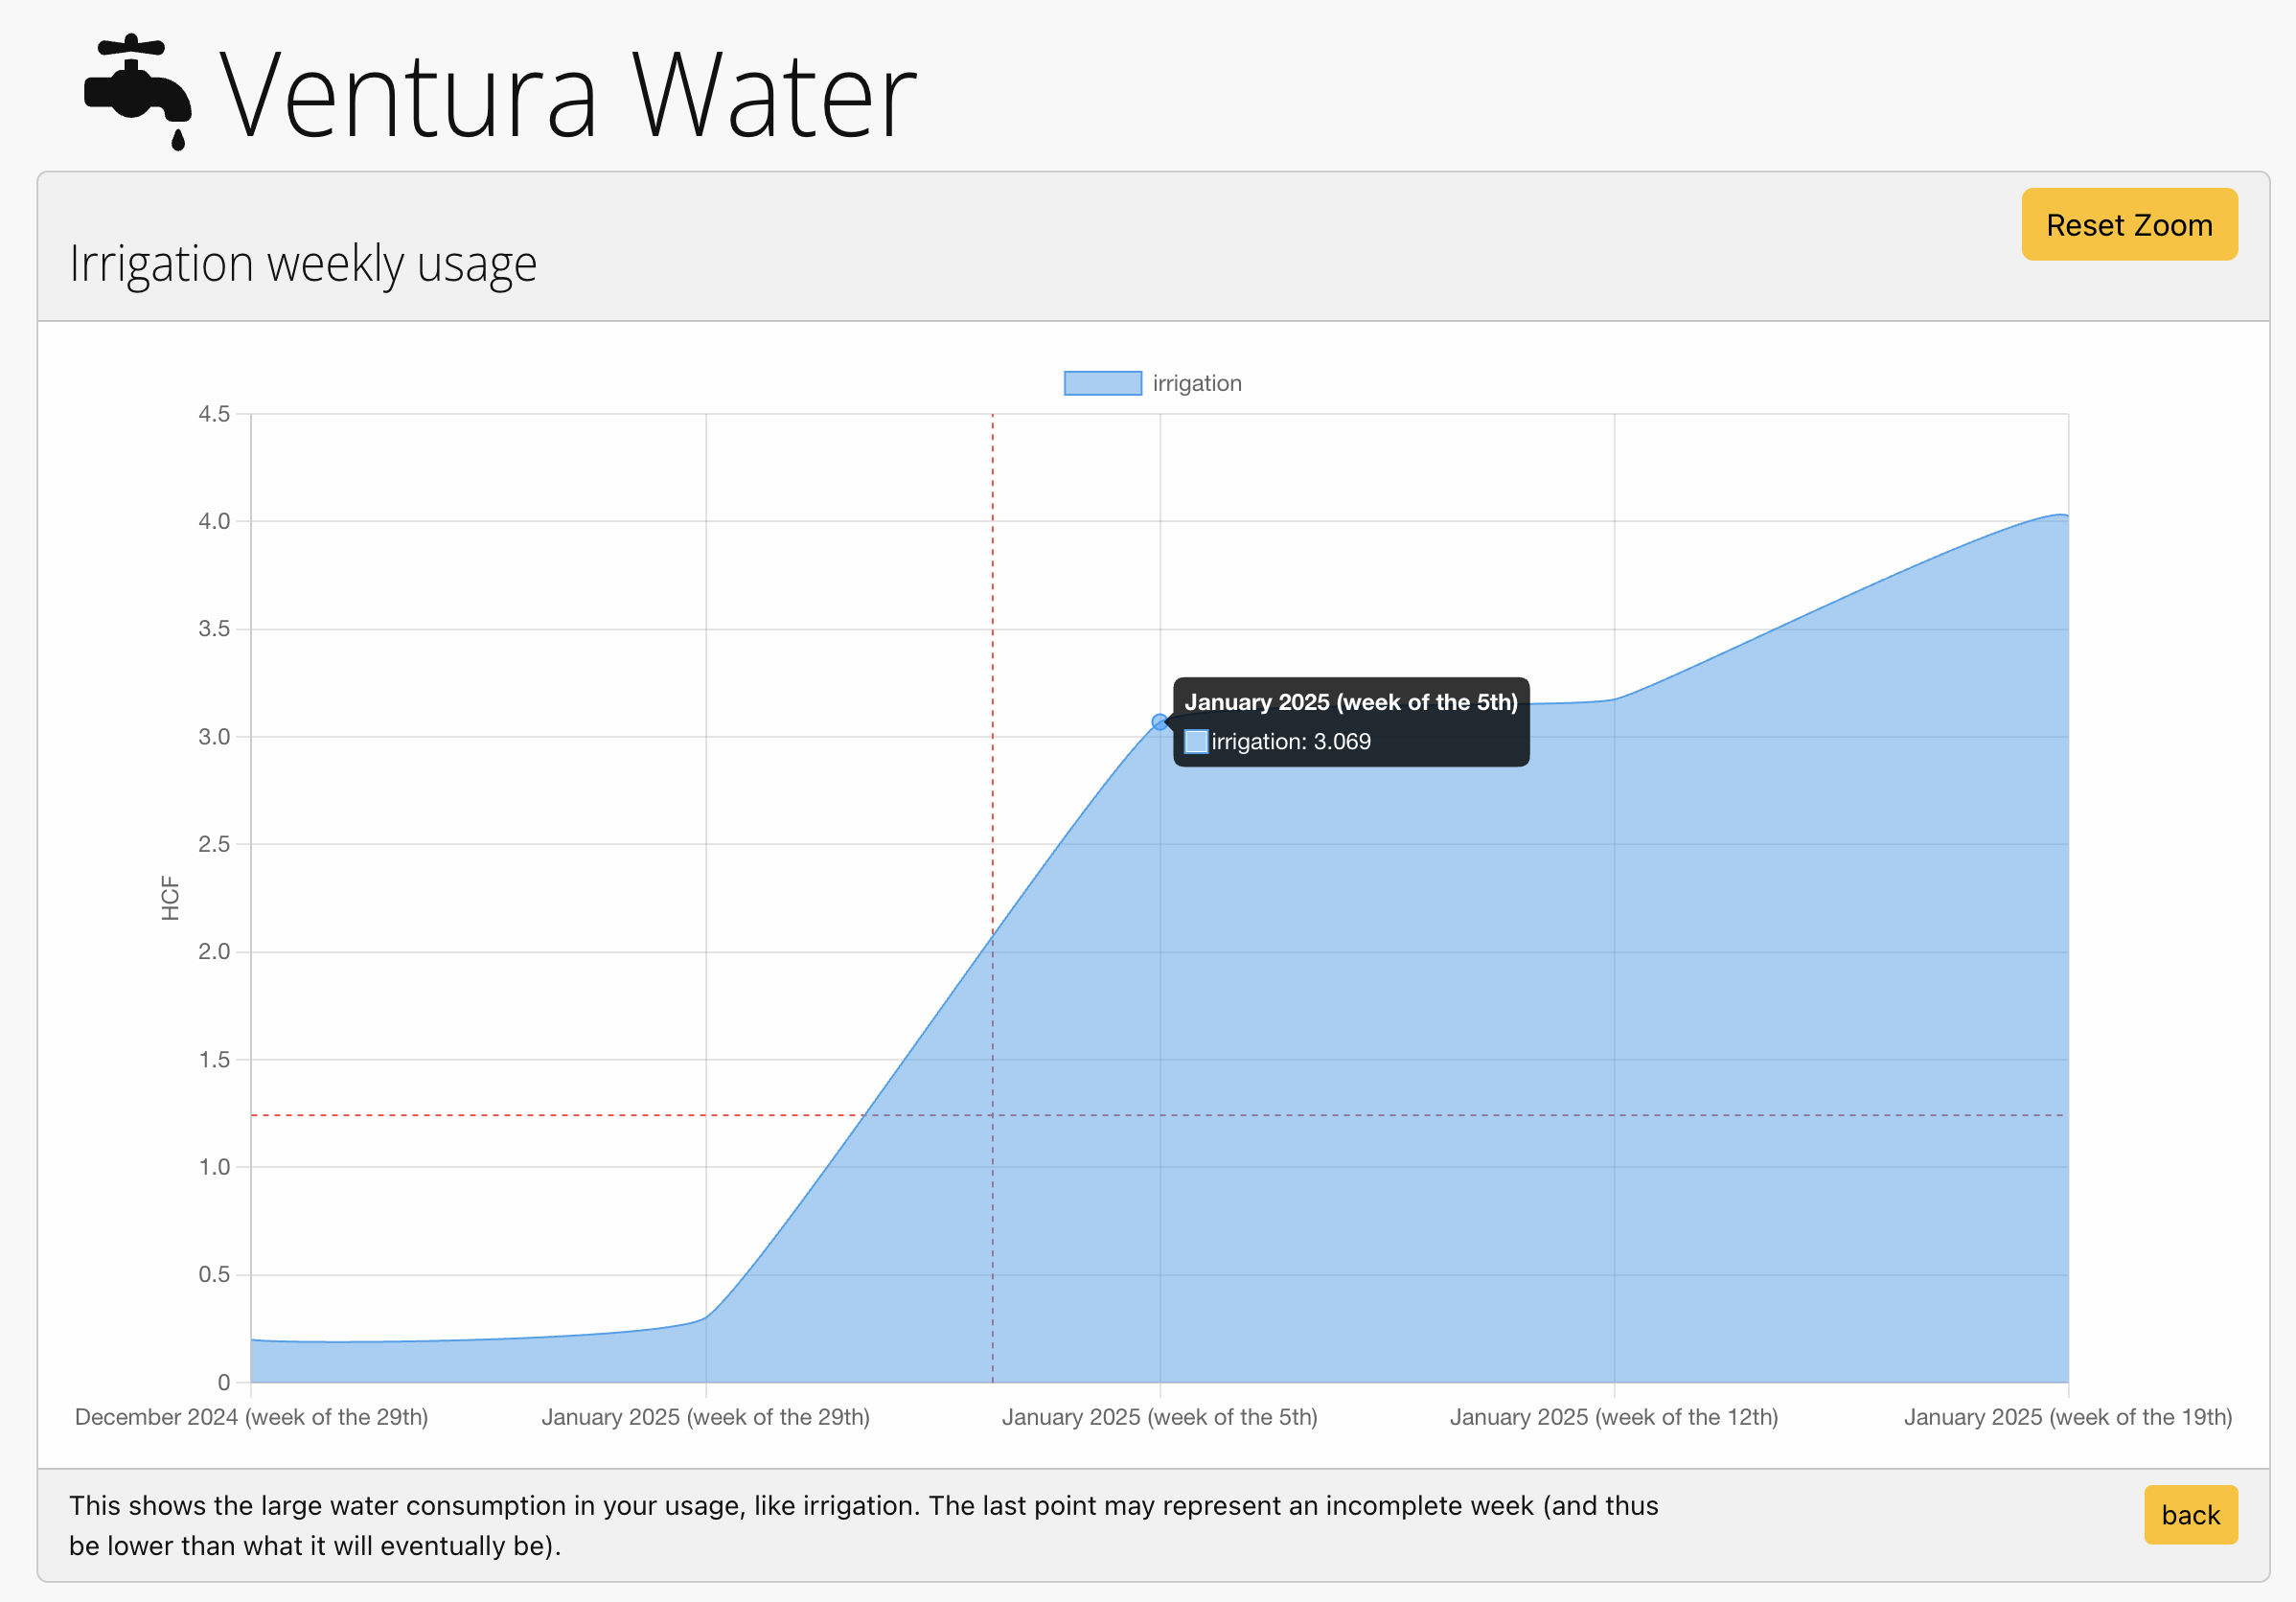
Youtilitics turns a confusingly high bill from your utility into a clear graph.
This 80% surge of price in this water bill was caused by irrigation.
How does it work with Village of Johnson?
Youtilitics analyzes your electricity consumption with Village of Johnson. Follow these steps:
- Connect your utility account. Link Village of Johnson (or upload Green Button / usage files) so Youtilitics can import meter history.
- Review charts for spikes and baseline load. Look for overnight baseline, irrigation peaks, EV charging windows, and HVAC ramps that drive the bill.
- Fix or schedule the biggest loads. Repair leaks, reprogram irrigation, move EV charging off-peak, and adjust thermostat schedules.
- Confirm savings with alerts and follow-up charts. Use spike alerts and month-over-month charts to verify usage dropped after each change.
This utility may not offer a public usage download path. Check your Village of Johnson dashboard for CSV or Green Button options. If you find one, please contact us to get it supported.
Please reach out if you are a Village of Johnson customer and
would
like your data in Youtilitics.
We will give you free access for a year if you help us support Village of Johnson.
Do I need to check Youtilitics every day?
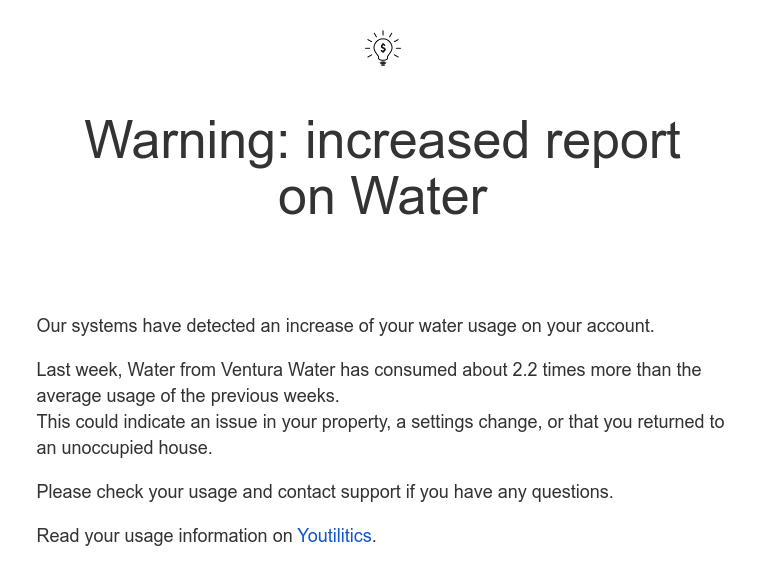
No. Systems check your usage routinely and can alert you if there is a sudden spike—so you hear about problems before the paper bill arrives.
Email alert
Problem solved
Frequently asked questions
How do I interpret my Village of Johnson bill?
Most Village of Johnson bills combine fixed charges (service/customer fees) with usage charges based on electricity consumed. Compare total usage to prior months, note any tier or time-of-use periods, and look for unusual spikes. Youtilitics charts the same meter data so you can see when usage rose instead of only seeing a dollar total.
What is a typical monthly usage for Village of Johnson customers?
Usage varies by home size, climate, and appliances. As a U.S. residential electricity benchmark, many households use roughly 855 kWh per month (about $139 at a national-average rate near 16.2¢/kWh). Your Village of Johnson history is the best baseline—compare your own months rather than a single national figure.
Can Youtilitics connect to Village of Johnson?
It depends on Village of Johnson. Check your online account for usage downloads (CSV or Green Button). If you find a download option, contact us so we can add support.
How can I lower my Village of Johnson bill?
Start with visibility: track electricity daily or hourly to find peaks. Common wins include fixing leaks or continuous irrigation, shifting EV charging off-peak, reducing baseline “always-on” load, and tuning HVAC setpoints. Then re-check the same charts after each change to confirm savings.
Sources and evidence
Figures below are approximate statewide or national averages for context. Your bill and tariff always control.
- U.S. Energy Information Administration (EIA) — Residential electricity prices and sales (Electric Power Monthly)
- U.S. Energy Information Administration — RECS — Residential Energy Consumption Survey (typical household usage)
- NREL National Solar Radiation Database — Solar resource context for rooftop potential notes
- U.S. Department of Energy — Home energy-saving practices and idle-load guidance
Start saving on your Village of Johnson bill.
Get alerts when your energy usage looks abnormal — free trial, no card required.