How to Build a Utility Tracker Spreadsheet (And Know When to Outgrow It)
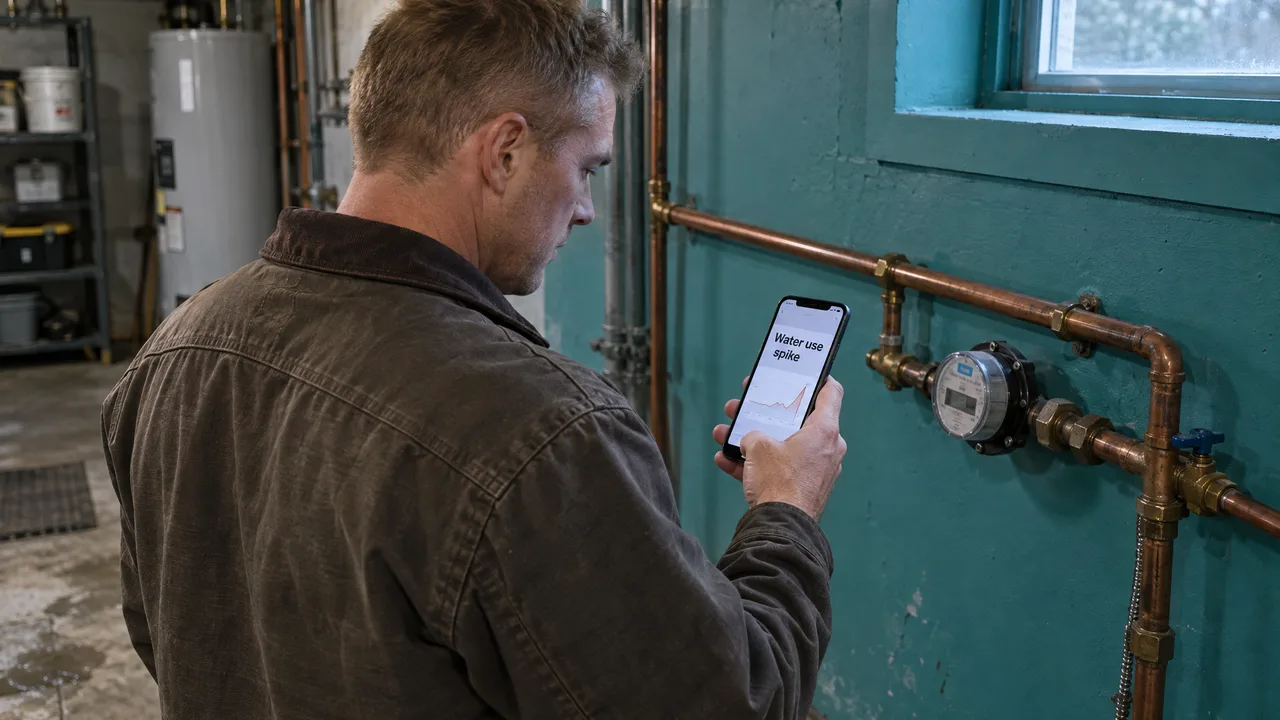
A functional utility tracking workbook logs exact meter read dates, raw consumption units (kWh, therms, gallons), and separated fixed fees so you can calculate normalized usage per billing day across every meter. A spreadsheet is a fine starting point for tracking utility use, especially for historical budgeting and invoice verification, though once you want daily anomaly alerts you should move to a tool that syncs your meters automatically. Building the workbook around physical consumption rather than invoice totals ensures that when you eventually outgrow manual data entry, your historical baseline is already clean.
Table of Contents
- What a Manual Utility Workbook Does and What It Cannot Do
- The Structural Criteria That Separate Actionable Logs From Dead Data
- Choosing Between Monthly Manual Entry and Daily Automated Monitoring
- Where DIY Consumption Tracking Breaks Down in Practice
- How Youtilitics Automates Daily Tracking Without Hardware
- Frequently Asked Questions
What a Manual Utility Workbook Does and What It Cannot Do
A utility tracking workbook is a structured ledger of meter read intervals, physical volume consumed, and tariff components built to verify invoices and establish seasonal baselines. It serves homeowners auditing household budgets, landlords reconciling master-metered buildings or tenant chargebacks, and small operations teams forecasting annual overhead. Unlike general accounting ledgers that only record dollar amounts by payment date, a true consumption workbook aligns entries to the physical meter read window so usage reflects weather and occupancy rather than billing department schedules. At the same time, it is not real-time monitoring, and it differs fundamentally from automated utility management software: a workbook is a retrospective audit log that only reveals a spike weeks after the meter recorded it, whereas active monitoring platforms ingest interval data daily to catch a running toilet, stuck HVAC relay, or vacant-unit heater before the billing cycle closes. ➀
The Structural Criteria That Separate Actionable Logs From Dead Data
Did your heat pump run longer during a cold snap, did the utility hike its delivery rider, or did the billing window stretch from 28 days to 34 days over the holidays? Without structural separation in your columns, all three causes look identical on a line chart.
Check your template against these operational criteria before trusting its trend lines:
- Service period start and end dates, not invoice due dates: Utility cycles rarely align with calendar months. Check that your sheet calculates exact cycle length (
End Date - Start Date) so a 33-day billing period does not masquerade as a consumption surge next to a 28-day February cycle. - Physical volume isolated from dollar totals: Rates shift seasonally and utilities adjust fuel riders mid-year. Verify that electric kWh, gas therms or CCF, and water gallons or HCF sit in dedicated numeric columns completely separate from total cost.
- Fixed base charges split from volumetric charges: Customer service fees, meter connection charges, and flat stormwater assessments stay constant even when a house sits empty. Look for separate columns for fixed fees and variable supply/delivery costs so calculated effective rates (
Variable Cost / Units) stay accurate. - Read type flag (Actual vs. Estimated): Utilities routinely estimate bills when a meter fails to report or weather blocks access, then issue a massive catch-up adjustment on the next actual read. Confirm your sheet includes a read-type indicator so an estimated trough followed by a trued-up peak does not corrupt your seasonal baseline.
- Unique meter identifier per row: Multi-unit properties and homes with separate irrigation or EV sub-meters generate multiple readings per address. Check that every row binds to a specific meter ID and utility type rather than just a street address, allowing clean pivot-table filtering without cross-contaminating electric and gas figures.
- Normalized daily consumption metric: Raw monthly totals distort comparisons across uneven cycles. Ensure a formula column divides raw units by cycle days (
Units / Billing Days) to produce average kWh, therms, or gallons per day: the single metric that makes year-over-year comparisons honest.
How to Do It
Create a raw ledger tab structured as a flat database table where every single meter reading occupies one row, resisting the temptation to put months across the top as column headers. Assign raw input columns for Property Name, Meter ID, Commodity (Electric, Gas, Water), Service Start Date, Service End Date, Read Type (Actual or Estimated), Raw Units Consumed, Unit Label, Fixed Charges, Variable Charges, and Total Invoice Amount. Keeping months in rows rather than columns lets you append years of multi-property history without ever rewriting a formula.
Add four calculated columns immediately to the right of your raw inputs so every new entry normalizes itself automatically. Calculate
Billing Daysby subtracting the Service Start Date from the Service End Date. DivideRaw Units ConsumedbyBilling Daysto generateUnits Per Day, divideVariable ChargesbyRaw Units Consumedto trackEffective Rate Per Unit, and extract theService Monthfrom the midpoint of the read window (Start Date + (Billing Days / 2)) so a cycle running from May 28 to June 27 maps cleanly to June rather than July when the PDF arrives.Pull your last twelve consecutive PDF bills for each utility account to seed a full four-season baseline before judging any single month's performance. Heating-dominated winter gas curves, summer cooling peaks, and summer irrigation schedules make month-to-month comparisons misleading on their own; comparing this June's
Units Per Dayagainst last June'sUnits Per Dayimmediately strips out seasonal noise and exposes equipment drift or behavioral shifts.Build a separate summary tab driven by pivot tables or
AVERAGEIFSformulas referencing your ledger tab, grouping by Property, Commodity, and Service Month. PlotUnits Per Dayon one chart andEffective Rate Per Uniton a second chart directly beneath it. Separating volume trends from rate trends lets property managers and homeowners answer in five seconds whether a high bill came from physical waste inside the building or a tariff change from the utility.Establish a monthly variance rule that flags any row where
Units Per Dayexceeds the prior year's same-month baseline by a meaningful margin, or where the minimum off-season water or electric floor creeps upward across three consecutive bills. When a row triggers your threshold, inspect the PDF bill's read type first to rule out an estimated-read catch-up, then check occupancy changes, thermostat schedules, or plumbing fixtures before paying the invoice.
Choosing Between Monthly Manual Entry and Daily Automated Monitoring
Your ownership model and risk exposure dictate how long a monthly spreadsheet remains sufficient. If you live in a single-family home, occupy it year-round, pay three predictable bills a month, and mainly want to verify whether insulation upgrades or thermostat adjustments reduced your year-over-year kWh per day, a normalized workbook does that job cleanly at zero software cost. You touch the sheet once a month when statements arrive, audit the math, and move on. The trade-off you accept is latency: if an outdoor spigot drips or a basement dehumidifier runs non-stop, you pay for up to thirty days of waste before the PDF statement lands in your inbox.
That latency math flips completely once you stop living on-site or start paying for someone else's consumption. Landlords offering utilities-included leases, short-term rental hosts turning over guests weekly, and owners holding vacant properties through winter face asymmetric downside from delayed data. A running flapper valve in a rental unit, an unauthorized space heater or EV charger plugged into a master-metered circuit, or a furnace failure in an empty house during a freeze event creates damage or overage bills that dwarf a software subscription in a single weekend. Waiting four to six weeks for a monthly statement turns a quick maintenance text into a four-figure invoice dispute.
Scale introduces a second breaking point even without acute leak risk. Typing numbers off PDFs for two or three personal accounts takes ten minutes a month; keying start dates, end dates, therms, kWh, HCF, and rider fees across fifteen or thirty rental meters quickly turns into hours of error-prone clerical work. Worse, utility portals expire old statements and throttle manual downloads, meaning one skipped busy month leaves permanent gaps in your ledger. Once your goal shifts from historical cost accounting to active asset protection (or once meter count makes manual entry a chore you procrastinate) automated daily utility sync stops being a convenience and becomes operational insurance.
Where DIY Consumption Tracking Breaks Down in Practice
Keying statement dates or check-payment dates instead of actual meter read windows ruins more spreadsheets than bad math ever does. A water bill dated August 5 might cover usage from June 24 through July 25, yet recording it as "August water" leads you to blame August landscaping or August tenants for a leak that happened over the Fourth of July weekend. Worse, if one payment slips across a month boundary, an accounting-style sheet shows zero cost in one month and double cost in the next, rendering trend lines useless. Always anchor every row to the meter's start and end dates printed on the usage detail page of the bill.
Treating all consumption units as interchangeable across properties or time periods introduces silent formula corruption when utilities change billing units or when a portfolio spans multiple municipal districts. One water district bills in thousands of gallons (kGal), while the neighboring city bills in hundred cubic feet (CCF or HCF, where one unit equals roughly 748 gallons). Natural gas statements similarly alternate between therms and CCF depending on heat-content multipliers printed in tiny type on page two. Mixing HCF and gallons in the same column makes one property look seven hundred times more efficient than the one across town unless you standardize units upon entry.
Relying on monthly averages hides continuous low-flow leaks and overnight baseload creep beneath normal daytime activity. Consider a household that travels for ten days in the middle of a billing cycle while a toilet flapper silently leaks the entire month: the ten empty days pull the monthly average down, making the 30-day Units Per Day figure look completely normal on your spreadsheet even though water ran nonstop 24 hours a day. Only interval data (hourly or daily meter reads that reveal whether usage ever drops to zero at 3:00 AM) can distinguish normal intermittent living from a continuous mechanical leak.
Confusing utility bill auditing software with hardware sub-metering, or assuming you must clamp physical hardware onto pipes and breaker panels just to get daily visibility: stalls upgrades long after a spreadsheet has stopped working. Hardware monitors such as Sense, Flume, or bluebot install physical equipment on electrical panels, meters, or plumbing lines to capture high-resolution flow or circuit data, which works well for a single homeowner tinkering with their own utility closet. Across ten rental doors or dispersed properties, scheduling access, maintaining local Wi-Fi bridges, and replacing batteries becomes an operational headache of its own, blinding owners to the simpler path of pulling smart-meter interval data directly from the utility account itself.
How Youtilitics Automates Daily Tracking Without Hardware
Youtilitics is a utility usage monitoring and leak and anomaly alert SaaS for homes and rental properties. Instead of typing numbers off PDF statements once a month (or scheduling installers to put hardware on pipes and breaker panels) we pull consumption data directly from your utility accounts. We connect via Green Button using OAuth2 with no password shared, or through our Sync Companion app, which runs a nightly sync while keeping utility credentials on your phone; you can read our technical breakdown on how we read your utility data safely without storing login passwords. For utilities without automatic sync, we support manual CSV upload.
Once connected, our AI learns each property's normal usage patterns and flags anomalies. It catches issues the same day rather than at bill time, sending email alerts only when something needs attention, including water leak detection when continuous flow runs 8+ hours. We built Youtilitics to work without installing sensors or hardware in units, giving landlords and hosts without a full ops team vacancy activity, freeze risk, and included-utility overage alerts. Property managers also get owner-ready exports and usage records around move-in and move-out, and you can access Youtilitics on Web, iPhone, and Android.
Because we rely on utility-side data feeds rather than physical clamp-on sensors, honesty about compatibility comes first. Utility coverage is not universal, especially for water, and automatic sync depends on utility compatibility with Green Button or supported Sync utilities. Property businesses must validate utility coverage before scaling a pilot, and our business plans are in early access with limited onboarding spots and cohorts; if you want to check multi-property fit, contact us or email support@youtilitics.com. Our 3-day free trial requires no credit card and lets you cancel anytime. Watch how daily meter tracking works in practice on our demo page, or review subscription options on our pricing page to stop waiting until bill day to discover a spike.
Frequently Asked Questions
Should I build my utility log in Excel, Google Sheets, or an automated platform?
Excel and Google Sheets calculate identical normalization formulas, though Google Sheets handles shared access better if a co-owner, bookkeeper, or on-site manager enters monthly statements from different locations. Both spreadsheets hit the same ceiling: neither connects to electric, gas, or water utilities on its own, meaning your visibility is always as stale as your last manual PDF entry. When you want daily background data sync without manual checking, moving to an automated utility monitoring platform eliminates data entry while catching abnormal usage between billing cycles.
How do I handle utility bills that overlap two calendar months in a spreadsheet?
Never split a single bill manually by guessing how much usage happened before and after the first of the month, unless you are closing out a tenant ledger at move-out using prorated daily averages. For ongoing tracking, record the exact start and end dates as billed, divide total units by the exact number of days in that read cycle, and assign the row to the month containing the majority of those billing days. Comparing normalized daily units year-over-year stays accurate even when read dates drift by several days each year.
What should I do if my water or electric utility does not support automatic data sync?
First, check your online utility portal for an "Export Usage" or "Download Interval Data" button, as utilities that lack automated OAuth2 connections often still allow customers to download hourly or daily smart-meter history as a CSV file. With Youtilitics, you can upload those manual CSV files as a fallback when Green Button or Sync Companion coverage is unavailable, letting you visualize patterns and spot baseload shifts without building custom spreadsheet charts from thousands of raw interval rows.
How far back should I gather bills when setting up utility tracking for the first time?
Pull at least twelve consecutive months of statements per meter before setting alert thresholds or judging property efficiency. Heating gas, air conditioning electricity, and outdoor water usage follow steep seasonal curves that make a three-month sample deceptive. A full twelve-month history captures both peak summer and peak winter loads alongside mild shoulder months (typically spring and fall), which reveal your property's true non-weather baseload: the underlying floor caused by water heaters, refrigerators, pool pumps, and continuous plumbing leaks.
Start saving on your bill.
Get alerts when your energy usage looks abnormal — free trial, no card required.